
Reach out to support@sosha.ai with any additional questions or submit a ticket below.
Submit ticketReviewing Analytics for an Individual Toolkit
Watch the tutorial below on how to access your analytics for a toolkit. Available data and historical range depend on your subscription tier.
To view toolkit analytics:
Select the toolkit you’d like to view in your organization menu.
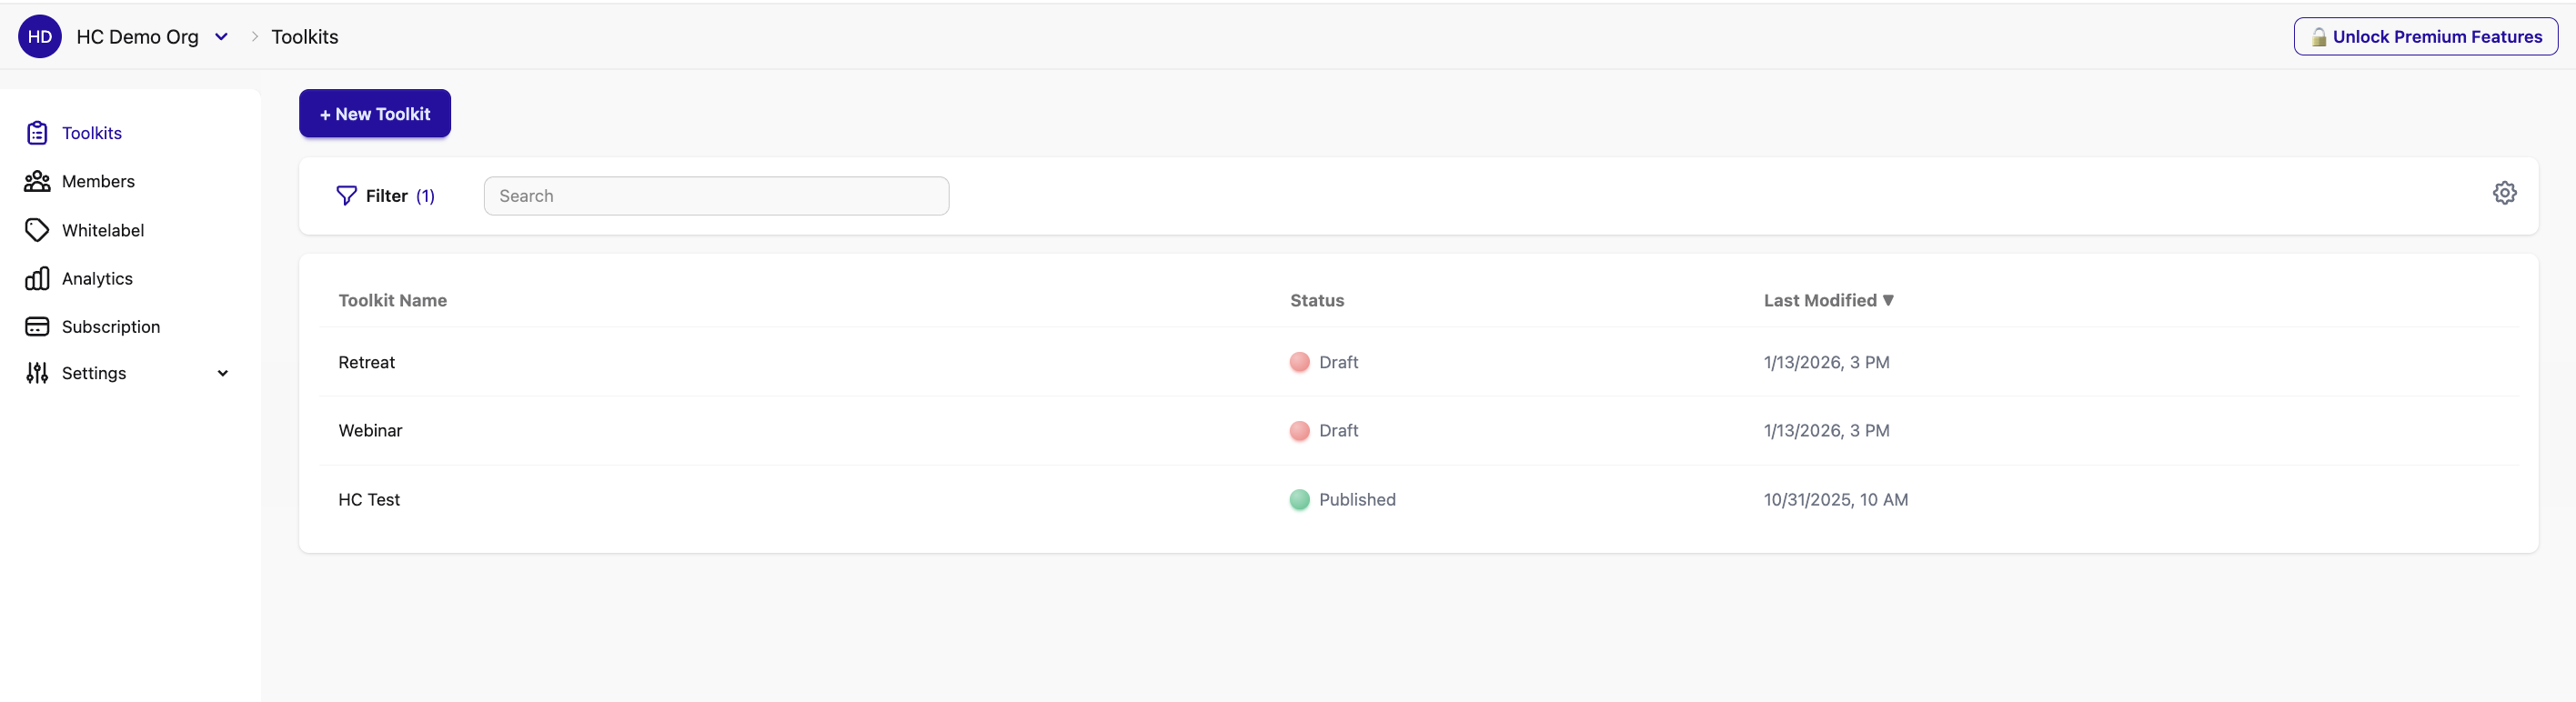
Once you've entered the portal of a toolkit, click the ‘Analytics’ tab on the left.

View the overall metrics:
- Change the time frame: Click the dates and adjust the time frame as needed. The history range depends on your subscription.

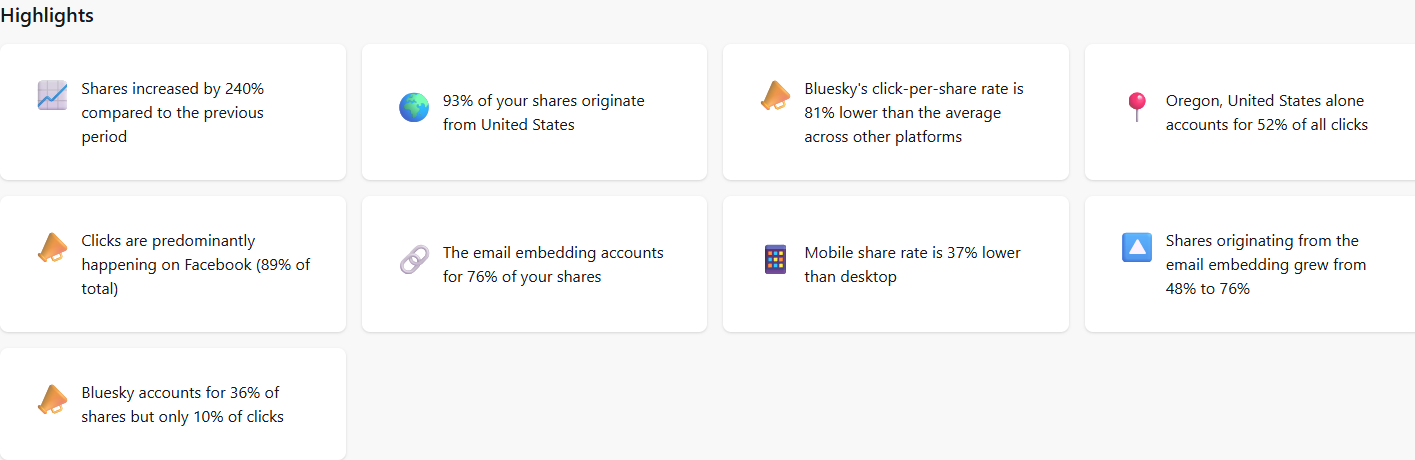
- Highlights: quick, toolkit-level insights from your analytics so you can see what’s happening at a glance.
Overview of Metrics:
Toolkit Audience: Compare toolkit visits with post shares to understand how many visitors are taking action.
Network flow: Track how shares lead to clicks across each social network.
Post Audience: Understand how clicks on shared posts lead to conversions, such as completed actions on your website.
- Note: To track conversions, set up a conversion pixel.
Generated Value: Review the estimated value generated by your toolkit activity. This includes actions such as clicks, conversions, or other tracked outcomes, depending on your conversion pixel setup.

Timeline Graphs:
- Shares and clicks by hour: For timeframes of three days or less, a line graph shows hourly shares and clicks generated by your toolkit.
- Shares and clicks by day: For timeframes longer than three days, the line graph displays daily shares and clicks.
- Click shares or clicks to only view one action.
Shares and clicks by social network: Understand which platforms are driving the most activity. Select Shares or Clicks to update the graph and view each metric separately.
Global Map:
Explore where toolkit activity is coming from.
On the left side, choose whether you want to view visits, shares, or clicks. You can display this data as either a map or a bar chart.
[[Include images]]
Breakdown by Origins:
Analyze clicks and shares based on how people accessed or shared the toolkit.
You can review performance by:
- Post attributes
- Device Types
- Link domains
- Media types
Cross segments:
Compare different segments to understand how your community shares across networks, origins, devices, media types, countries, and toolkits.
Use the dropdown menus to select two segments to compare. Available segments include:
- Network
- Origin
- Device
- Media type
- Country
- Toolkit
For example, you can compare network and device type to understand which social networks are driving activity on different devices.
Post insights:
Review individual post performance to identify which posts receive the most shares and clicks.